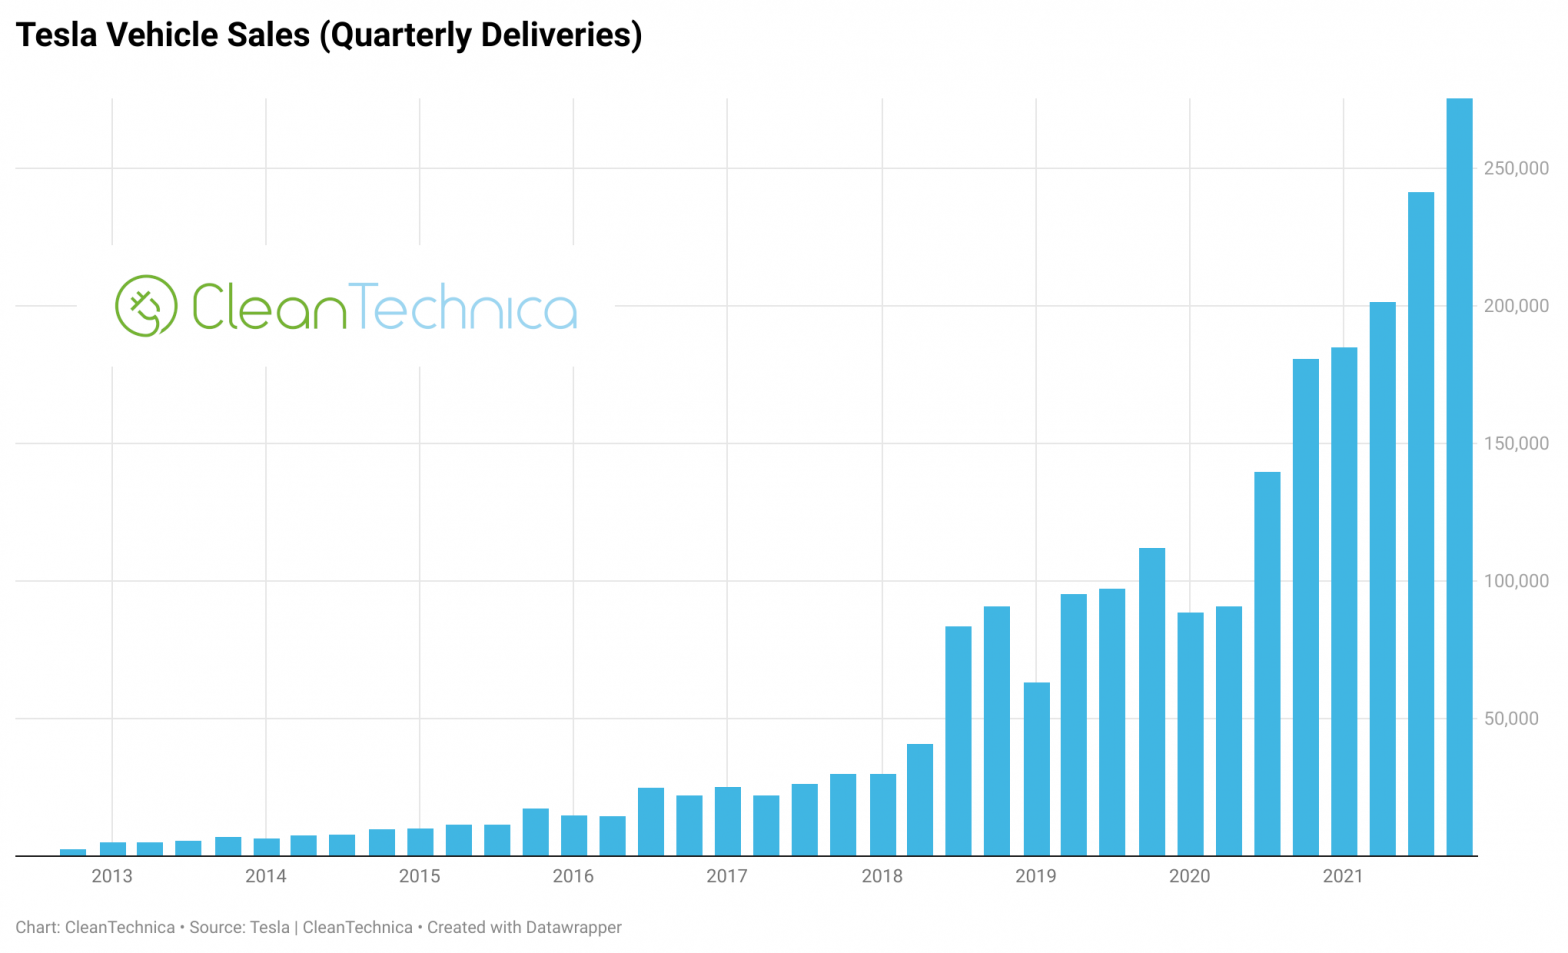
With Tesla’s 4th quarter and full-year 2021 sales figures in, it’s time to look at those numbers in the context of history. As Will Meek has pointed out in a couple of comments under this article, Tesla actually reached 1.4% of global light-duty passenger vehicle sales last year. Clearly, its rise up the sales charts has been tremendous and impressive.
First of all, simplest is to look at Tesla’s total quarterly vehicle deliveries over time. I’ve been creating this chart longer than I remember, and almost each quarter over the past few years shows a significant rise up, some a sharp rise up. The past few quarters show a strong rise, which has largely come from Giga Shanghai ramping up its production capacity more and more. The jump from Q3 to Q4 was unexpected by most, quite a big rise in the midst of global supply chain shortages (see: global automotive chip situation).
Splitting out these figures by the model pairs Tesla reports data for, below is a graph that highlights in dramatic fashion which two Tesla models have driven the sales growth. The Tesla Model 3–Model Y duo is where all (or more than all) of Tesla’s sales growth has originated.
Naturally, many would like to know exactly how these individual vehicles’ sales split out. Alas, without Tesla telling us, we are left to various clues, registration data, and our own assumptions (aka guesses). I do not have definitive insight on this matter, but below is how I’m estimating the split.
Getting a cleaner look at the two big dogs (which happen to be the little dogs) and how their delivery totals have grown, below is a version of that graph with the Model S and Model X removed. The Model 3’s ramp-up was long considered one of the most notable and perhaps highest-revenue product ramp-ups in the world, yet the Model Y just flew by it and rose from nothing to 150,000+ quarterly deliveries as if it was a cutting-edge electric vertical takeoff and landing (eVTOL) jet and the Model 3 was a sputtering old 1950s airplane.
At the same time, the next two charts show a different perspective that’s fascinating in its own right. Despite the Model Y’s rapid sales rise, cumulative sales show how far the Model 3 is still ahead. It has racked up quite a heap of customer deliveries, surpassing one million in the 2nd quarter of 2021 and collecting another quarter million or so since then. The Model Y, meanwhile, seems to have just passed half a million global sales.
Interactive versions of all of these charts as well as one more type of chart that lets you flick through the sales rise of each model are below. They are best viewed on a computer, rather than a phone.
Appreciate CleanTechnica’s originality? Consider becoming a CleanTechnica Member, Supporter, Technician, or Ambassador — or a patron on Patreon.
Advertisement


