undefined undefined/iStock via Getty Images
How the mighty have fallen
FAANG stocks (expanded) (StockCharts)
Above is an expanded list of “FAANG” stocks that include Amazon (AMZN) and Microsoft (MSFT). Four on the list (Amazon, Meta/Facebook (FB), Google (GOOG), (GOOGL), and Netflix (NFLX)) are at or near 52-week lows. Microsoft is drifting lower; Apple (AAPL) is trending sideways in a consolidation pattern. None of them has been in a rally since the end of last year.
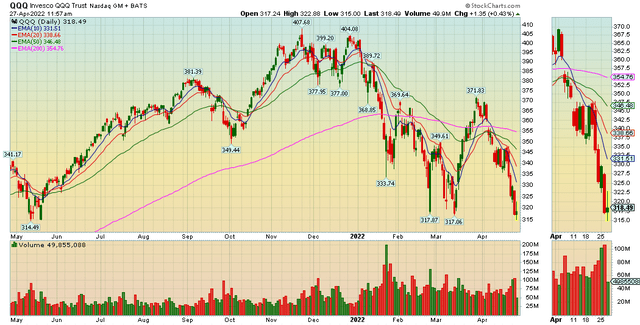
Now let’s take a look at the QQQ:
The QQQ peaked with a triple top in 4Q21. It then sold off and is now near a 52-week low.
China’s zero-tolerance policy is causing serious problems:
The omicron variant of the coronavirus slipped through China’s border controls and is causing the largest outbreaks since Wuhan in 2020. About a quarter of China’s population lives in cities that are now under some form of lockdown. Most of Shanghai’s 25 million residents have been confined to their homes for more than a month. High-frequency indicators, such as city-to-city truck flows, suggest China’s economy is contracting, and residents in multiple cities are struggling to find food and even dying from lack of medicines.
The economic outlook ranges from bad to very bad. In the most optimistic scenarios, the pace of new outbreaks slows as cities institute early and short lockdowns. In worse-case scenarios, China could face multiple Shanghais each month over the second and third quarters, which would raise the risk of a recession – something the country hasn’t seen in the modern era.
But China’s leadership is returning to its old ways to help:
China’s President Xi Jinping made a bold commitment to boost infrastructure construction in Beijing’s latest bid to rescue economic growth, a strategy that may prove less effective this time around as authorities take a hardline approach to bringing Covid outbreaks under control.
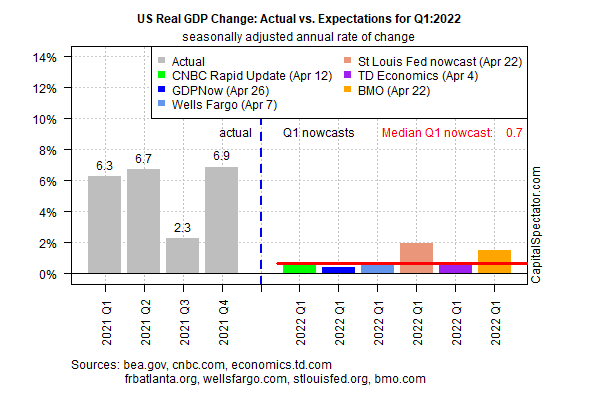
Tomorrow’s GDP report doesn’t look promising:
GDP estimates (Capital Spectator)
The median Q1 estimate is a weak 0.7% rise, a fraction of the 6.9% surge in the previous quarter, according to the Bureau of Economic Analysis. Today’s revised Q1 nowcast is roughly in line with the previous estimate published on Apr. 12.
Last week, I posted the NY Fed and Atlanta GDP estimates, both of which confirm a low reading. Considering the bearish mood in the markets, a bad GDP read could be a large selling trigger.
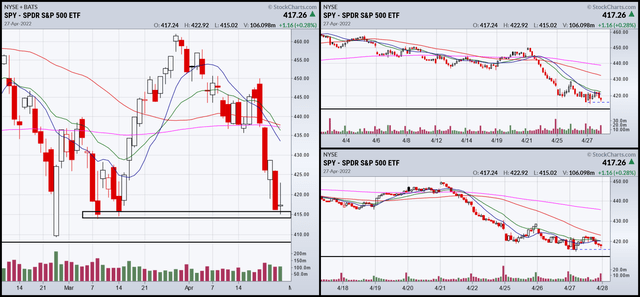
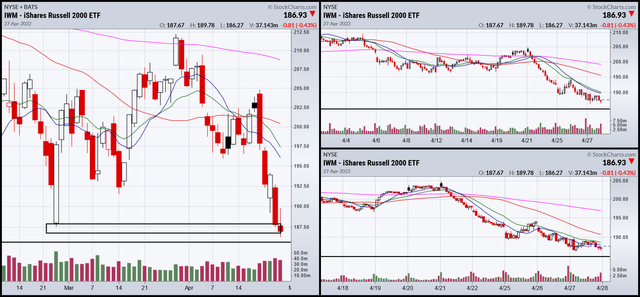
Let’s turn to the charts, which show one clear message:
SPY 3-month, 1-month, and 2-week (StockCharts)
The SPY is right at technical support, as is…
QQQ 3-month, 1-month, and 2-week (StockCharts)
…the QQQ, and…
IWM 3-Month, 1-month, and 2-week (StockCharts)
…the IWM.
Most importantly, none of the 1-month or 2-week charts are showing any kind of bottoming pattern.
Tomorrow’s GDP just became really important. The ride could get very bumpy.

