
Despite posting solid Q3 results, PayPal Holdings, Inc. (NASDAQ: PYPL) took a double-digit dive in the most recent trading session. It seems that the cautious guidance spooked the market, while other positive catalyst news failed to reverse the downward trend that has been going on for months.
As the stock dropped over 30% from the summer highs, in this article, we’ll take a look into the valuation according to our model.
View our latest analysis for PayPal Holdings
Third-quarter 2021 results:
- Revenue: US$6.18b (up 13% from 3Q 2020)
- Net income: US$1.09b (up 6.5% from 3Q 2020)
- Profit margin: 18% (down from 19% in 3Q 2020)
The company reported a solid third-quarter result with improved earnings and revenues, although profit margins were weaker. Over the last 3 years, on average, earnings per share have increased by 35% per year, and the company’s share price has also increased by 35% per year.
While PayPal announced it would not be pursuing the Pinterest acquisition, its stock didn’t recover the ground it lost upon the initial rumor. It was one of the interesting „sell the rumor, sell the news“ moments.
Meanwhile, CFO John Rainey advised caution regarding the beginning of the next year, especially regarding the eBay payment migration and comparison to the beginning of this year which was heavily influenced by the government stimulus.
This prompted a series of price target adjustments, as Morgan Stanley now sees it at US$265 (revised from US$340), Oppenheimer at US$268 (from US$329), and Citi at US$300 (from US$350). Yet, after acknowledging the headwinds – quoting supply chain issues, disappearing stimulus, and other aftershocks of the pandemic, they remain positive on the stock.
One of the main reasons for that can be a deal that Venmo announced with Amazon. This popular mobile payment service which PayPal owns, will be available as a payment option on Amazon.com in 2022.
Approaching Intrinsic Value
Discounted Cash Flow (DCF) model believes that a company’s value is the present value of all of the cash it will generate in the future. It works by taking the forecast future cash flows of the company and discounting them back to today’s value.
However, a DCF is just one valuation metric among many, and it is not without flaws. For those keen learners of equity analysis, the Simply Wall St analysis model here may be something of interest to you.
The calculation
We’re using the 2-stage growth model, which means we take two stages of the company’s growth. In the initial period, the company may have a higher growth rate, and the second stage is usually assumed to have a stable growth rate. In the first stage, we need to estimate the cash flows to the business over the next ten years. Where possible, we use analyst estimates, but when these aren’t available, we extrapolate the previous free cash flow (FCF) from the last estimate or reported value.
We assume companies with shrinking free cash flow will slow their rate of shrinkage and that companies with growing free cash flow will see their growth rate slow over this period. We do this to reflect that growth tends to slow more in the early years than in later years.
Generally, we assume that a dollar today is more valuable than a dollar in the future, and so the sum of these future cash flows is then discounted to today’s value:
10-year free cash flow (FCF) forecast
| 2022 | 2023 | 2024 | 2025 | 2026 | 2027 | 2028 | 2029 | 2030 | 2031 | |
| Levered FCF ($, Millions) | US$7.47b | US$9.25b | US$10.9b | US$12.6b | US$13.8b | US$14.8b | US$15.7b | US$16.4b | US$17.0b | US$17.6b |
| Growth Rate Estimate Source | Analyst x13 | Analyst x13 | Analyst x3 | Analyst x2 | Est @ 9.71% | Est @ 7.38% | Est @ 5.76% | Est @ 4.62% | Est @ 3.82% | Est @ 3.26% |
| Present Value ($, Millions) Discounted @ 6.5% | US$7.0k | US$8.2k | US$9.0k | US$9.8k | US$10.1k | US$10.1k | US$10.1k | US$9.9k | US$9.6k | US$9.3k |
(“Est” = FCF growth rate estimated by Simply Wall St)
Present Value of 10-year Cash Flow (PVCF) = US$93b
After calculating the present value of future cash flows in the initial 10-year period, we need to calculate the Terminal Value, which accounts for all future cash flows beyond the first stage. For a number of reasons, a very conservative growth rate is used that cannot exceed that of a country’s GDP growth. In this case, we have used the 5-year average of the 10-year government bond yield (2.0%) to estimate future growth. In the same way, as with the 10-year ‘growth’ period, we discount future cash flows to today’s value, using a cost of equity of 6.5%.
Terminal Value (TV)= FCF2031 × (1 + g) ÷ (r – g) = US$18b× (1 + 2.0%) ÷ (6.5%– 2.0%) = US$391b
Present Value of Terminal Value (PVTV)= TV / (1 + r)10= US$391b÷ ( 1 + 6.5%)10= US$207b
The total value is the sum of cash flows for the next ten years plus the discounted terminal value, which results in the Total Equity Value, which in this case is US$300b. To get the intrinsic value per share, we divide this by the total number of shares outstanding.
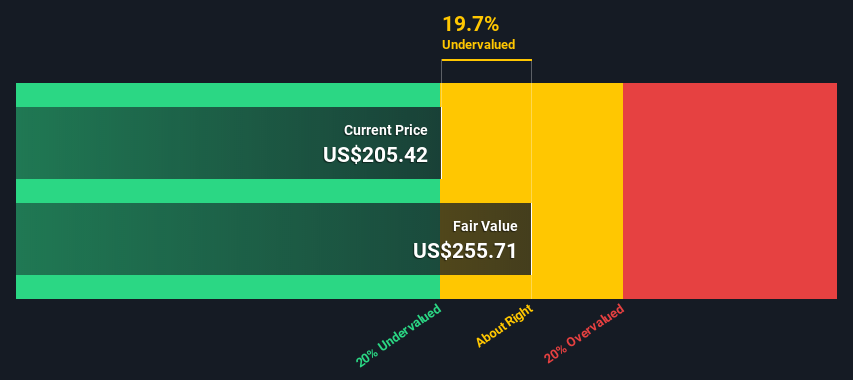
Compared to the current share price of US$205, the company appears about fair value at a 20% discount to where the stock price trades currently. The assumptions in any calculation have a big impact on the valuation, so it is better to view this as a rough estimate, not precise down to the last cent.
Important assumptions
Now the most important inputs to a discounted cash flow are the discount rate, and of course, the actual cash flows. Part of investing is coming up with your own evaluation of a company’s future performance, so try the calculation yourself and check your own assumptions. The DCF does not consider the possible cyclicality of an industry or a company’s future capital requirements, so it does not give a full picture of its potential performance.
Given that we are looking at PayPal Holdings as potential shareholders, the cost of equity is used as the discount rate rather than the cost of capital (or the weighted average cost of capital, WACC), which accounts for debt. We’ve used 6.5% in this calculation, which is based on a levered beta of 1.047.
Moving On:
Whilst important, the DCF calculation shouldn’t be the only metric you look at when researching a company. Overall it seems like our valuation is in-line with some of the more conservative analyst’s price targets that we have mentioned.
However, do keep in mind that the DCF model is not a perfect stock valuation tool. Instead, the best use for a DCF model is to test certain assumptions and theories to see if they would lead to the company being undervalued or overvalued. If a company grows at a different rate, or if its cost of equity or risk-free rate changes sharply, the output can look very different.
For PayPal Holdings, we’ve put together three essential aspects you should consider:
- Risks: To that end, you should be aware of the 2 warning signs we’ve spotted with PayPal Holdings.
- Future Earnings: How does PYPL’s growth rate compare to its peers and the wider market? Dig deeper into the analyst consensus number for the upcoming years by interacting with our free analyst growth expectation chart.
- Other Solid Businesses: Low debt, high returns on equity, and good past performance are fundamental to a strong business. Why not explore our interactive list of stocks with solid business fundamentals to see if there are other companies you may not have considered!
PS. The Simply Wall St app conducts a discounted cash flow valuation for every stock on the NASDAQGS every day. If you want to find the calculation for other stocks, search here.
Simply Wall St analyst Stjepan Kalinic and Simply Wall St have no position in any of the companies mentioned. This article is general in nature. We provide commentary based on historical data and analyst forecasts only using an unbiased methodology and our articles are not intended to be financial advice. It does not constitute a recommendation to buy or sell any stock and does not take account of your objectives, or your financial situation. We aim to bring you long-term focused analysis driven by fundamental data. Note that our analysis may not factor in the latest price-sensitive company announcements or qualitative material.
Have feedback on this article? Concerned about the content? Get in touch with us directly. Alternatively, email editorial-team@simplywallst.com